Prometheus - Collect Syslog Messages with Grok Exporter
Grok Exporter is a standalone module what we can use to parse syslog messages and pass it to a monitoring tool like Prometheus.
Prerequisite
If you want to run this module with dummy data, create a new log file with these syslog messages
1
2
sudo mkdir /opt/python-syslog/
sudo nano /opt/python-syslog/output-syslog.log
1
2
3
4
5
6
7
8
9
10
11
12
13
14
15
16
17
18
19
20
21
22
23
24
25
26
27
28
*Jul 17 11:43:38.380: %OSPF-5-ADJCHG: Process 1, Nbr 1.1.2.3 on GigabitEthernet2 from LOADING to FULL, Loading Done
*Jul 17 11:43:43.836: %LDP-5-NBRCHG: LDP Neighbor 1.1.2.3:0 (1) is UP
*Jul 17 11:44:16.139: %LDP-5-NBRCHG: LDP Neighbor 1.1.2.1:0 (3) is UP
*Jul 17 11:44:17.730: %LDP-5-NBRCHG: LDP Neighbor 1.1.2.2:0 (4) is UP
*Jul 18 07:22:30.507: %LDP-5-NBRCHG: LDP Neighbor 1.1.2.3:0 (1) is DOWN (TCP connection closed by peer)
*Jul 18 07:23:10.473: %OSPF-5-ADJCHG: Process 1, Nbr 1.1.2.3 on GigabitEthernet2 from FULL to DOWN, Neighbor Down: Dead timer expired
*Jul 18 07:25:05.796: %LDP-5-NBRCHG: LDP Neighbor 1.1.2.1:0 (3) is DOWN (Session KeepAlive Timer expired)
*Jul 18 07:25:09.234: %LDP-5-NBRCHG: LDP Neighbor 1.1.2.2:0 (4) is DOWN (Session KeepAlive Timer expired)
*Jul 18 07:25:57.265: %OSPF-5-ADJCHG: Process 1, Nbr 1.1.2.3 on GigabitEthernet2 from LOADING to FULL, Loading Done
*Jul 18 07:26:00.670: %LDP-5-NBRCHG: LDP Neighbor 1.1.2.3:0 (1) is UP
*Jul 18 07:26:04.974: %LDP-5-NBRCHG: LDP Neighbor 1.1.2.2:0 (3) is UP
*Jul 18 07:26:05.541: %LDP-5-NBRCHG: LDP Neighbor 1.1.2.1:0 (4) is UP
*Jul 18 15:58:58.933: %LDP-5-NBRCHG: LDP Neighbor 1.1.2.1:0 (4) is DOWN (Session KeepAlive Timer expired)
*Jul 19 06:26:56.659: %SEC_LOGIN-5-LOGIN_SUCCESS: Login Success [user: helena] [Source: 10.16.36.109] [localport: 22] at 06:26:56 UTC Wed Jul 19 2023
*Jul 19 06:27:05.682: %SYS-6-CLOCKUPDATE: System clock has been updated from 06:27:05 UTC Wed Jul 19 2023 to 13:27:05 GMT Wed Jul 19 2023, configured from console by helena on vty0 (10.16.36.109).
*Jul 19 06:27:07.275: %SYS-5-CONFIG_I: Configured from console by helena on vty0 (10.16.36.109)
*Jul 19 06:29:28.607: %SYS-6-LOGOUT: User helena has exited tty session 1(10.16.36.109)
*Jul 19 06:53:51.564: %SEC_LOGIN-5-LOGIN_SUCCESS: Login Success [user: helena] [Source: 10.16.36.109] [localport: 22] at 13:53:51 GMT Wed Jul 19 2023
*Jul 19 06:54:00.280: %SYS-6-LOGGINGHOST_STARTSTOP: Logging to host 198.18.0.202 port 0 CLI Request Triggered
*Jul 19 06:54:01.281: %SYS-6-LOGGINGHOST_STARTSTOP: Logging to host 198.18.0.202 port 514 started - CLI initiated
*Jul 19 06:55:12.582: %SYS-5-CONFIG_I: Configured from console by helena on vty0 (10.16.36.109)
*Jul 19 06:55:35.935: %LINEPROTO-5-UPDOWN: Line protocol on Interface Loopback2, changed state to up
*Jul 19 06:55:42.307: %LINEPROTO-5-UPDOWN: Line protocol on Interface Loopback2, changed state to down
*Jul 19 06:55:42.307: %LINK-5-CHANGED: Interface Loopback2, changed state to administratively down
*Jul 19 07:05:40.593: %SYS-6-TTY_EXPIRE_TIMER: (exec timer expired, tty 1 (10.16.36.109)), user helena
*Jul 19 07:05:40.594: %SYS-6-LOGOUT: User helena has exited tty session 1(10.16.36.109)
*Jul 19 07:05:40.594: %SYS-5-CONFIG_I: Configured from console by helena on vty0 (10.16.36.109)
*Jul 19 07:35:10.423: %SEC_LOGIN-5-LOGIN_SUCCESS: Login Success [user: helena] [Source: 10.16.36.109] [localport: 22] at 14:35:10 GMT Wed Jul 19 2023
Otherwise, if you want to use real syslog data by creating your own syslog server, check out this post on how to Create Syslog Server with Python
Setting up Grok Exporter
First, download the Grok Exporter file and unzip it.
1
2
wget https://github.com/fstab/grok_exporter/releases/download/v1.0.0.RC5/grok_exporter-1.0.0.RC5.linux-amd64.zip
unzip grok_exporter-1.0.0.RC5.linux-amd64.zip
Then copy the files to the installation directory
1
2
cd grok_exporter-1.0.0.RC5.linux-amd64
sudo cp -r grok_exporter patterns/ /usr/local/bin/
Next create a configuration file
1
sudo nano /usr/local/bin/grok.yml
Paste in this config
1
2
3
4
5
6
7
8
9
10
11
12
13
14
15
16
17
18
19
20
21
22
23
24
25
26
global:
  config_version: 3
input:
  type: file
  path: /opt/python-syslog/output-syslog.log
  readall: true
imports:
- type: grok_patterns
  dir: ./patterns
grok_patterns:
- 'CISCOTIMESTAMPTZ %{MONTH} +%{MONTHDAY}(?: %{YEAR})? %{TIME}(?: %{TZ})?'
metrics:
- type: counter
  name: cisco_log_xxz
  help: For cisco network device syslog messages.
  match: '%{CISCOTIMESTAMPTZ:cisco_timestamp}: %%{DATA:facility}-%{POSINT:severity:int}-%{DATA:mnemonic}: %{GREEDYDATA:log_message}: %{IP:target_ip}'
  labels:
    timestamp: ''
    facility: ''
    severity: ''
    mnemonic: ''
    log_message: ''
    target_ip: ''
server:
  protocol: http
  port: 9144
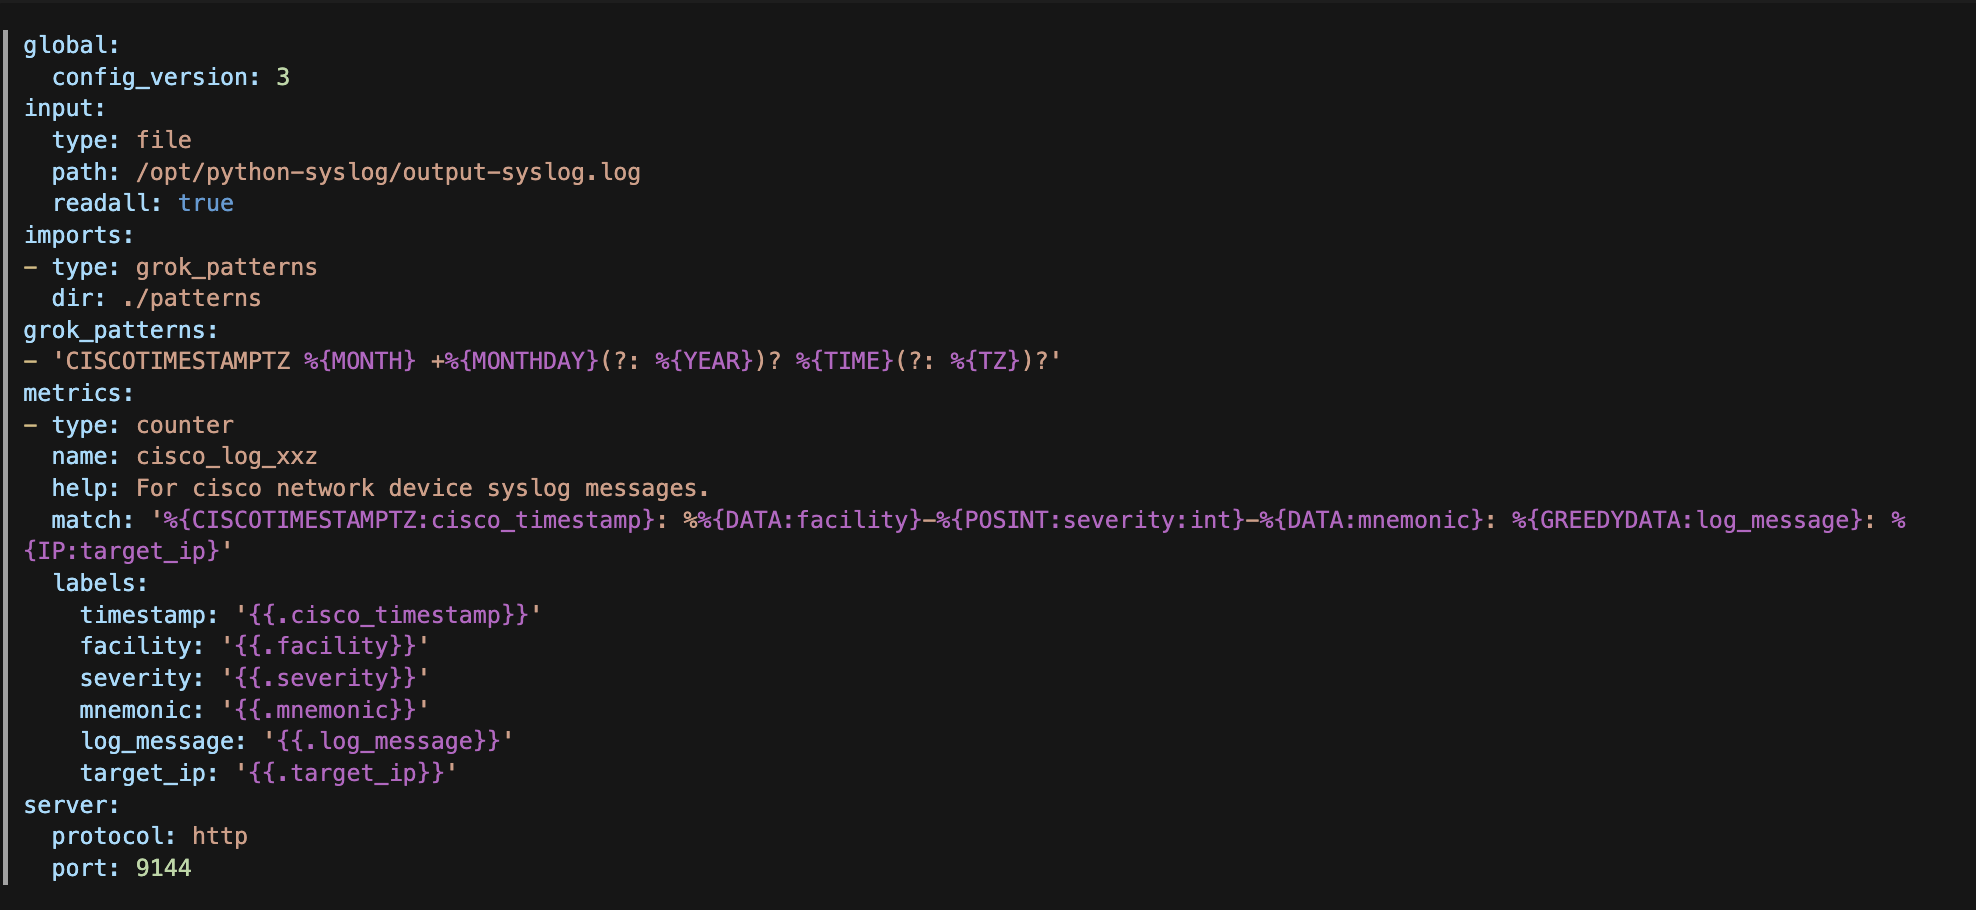
A brief explanation for this config :
path: is where your syslog file located
imports: are where all the predefined grok patterns located
grok_patterns: are additional patterns that’s not available inside the imported above
name: is the name that you will use to find these metrics inside prometheus later
match: is the expression matched to collect and map each metric into their own labels
Here’s the capture of the config file because for some reason some strings are not being rendered.
After that create the service file
1
sudo nano /etc/systemd/system/grok-exporter.service
Paste in these lines
1
2
3
4
5
6
7
8
9
10
11
12
13
[Unit]
Description=Prometheus grok_exporter server

[Service]
Restart=always
WorkingDirectory=/usr/local/bin
ExecStart=/usr/local/bin/grok_exporter --config=/usr/local/bin/grok.yml
ExecReload=/bin/kill -HUP $MAINPID
TimeoutStopSec=20s
SendSIGKILL=no

[Install]
WantedBy=multi-user.target
Now start the service
1
2
3
sudo systemctl daemon-reload
sudo systemctl start grok-exporter
sudo systemctl enable grok-exporter
Check the service status
1
systemctl status grok-exporter
1
2
3
4
5
6
7
8
9
10
11
12
● grok-exporter.service - Prometheus grok_exporter server
     Loaded: loaded (/etc/systemd/system/grok-exporter.service; disabled; vendor preset: enabled)
     Active: active (running) since Wed 2023-07-19 08:46:30 UTC; 4s ago
   Main PID: 8790 (grok_exporter)
      Tasks: 8 (limit: 9386)
     Memory: 4.1M
        CPU: 32ms
     CGroup: /system.slice/grok-exporter.service
             └─8790 /usr/local/bin/grok_exporter --config=/usr/local/bin/grok.yml

Jul 19 08:46:30 ubuntux systemd[1]: Started Prometheus grok_exporter server.
Jul 19 08:46:30 ubuntux grok_exporter[8790]: Starting server on http://ubuntux:9144/metrics
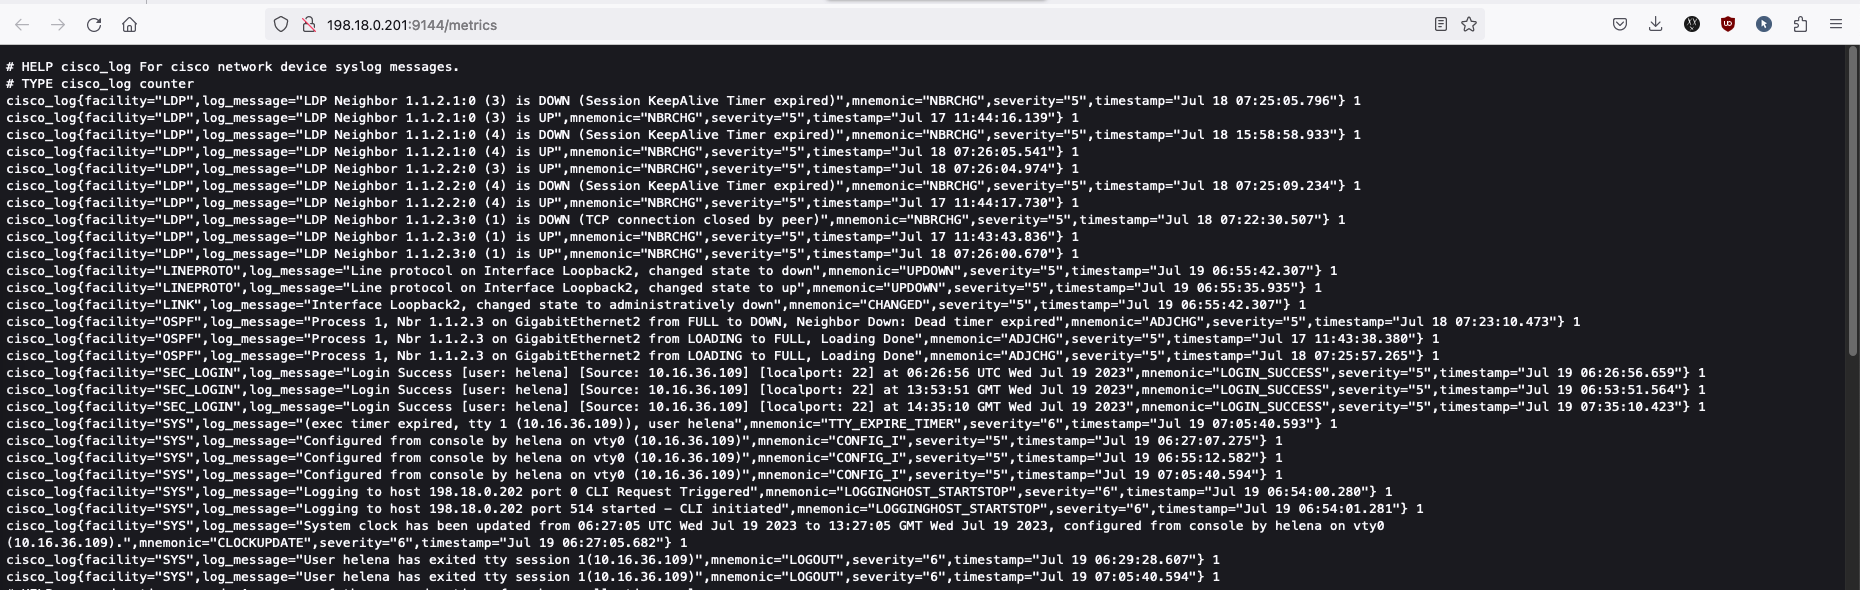
We can also access the metrics on http://198.18.0.201:9144/metrics, where you can see the grok exporter has successfully collected and parsed the syslogs messages
Adding Grok Exporter to Prometheus
Access the prometheus server (if it’s on different server), and open the config file.
1
sudo nano /etc/prometheus/prometheus.yml
And add this on the very bottom of the config file
1
2
3
  - job_name: 'grok_exporter'
    static_configs:
      - targets: ['localhost:9144']
target is where the grok exporter installed
Run this command to make sure the config is all good
1
promtool check config /etc/prometheus/prometheus.yml
1
2
3
4
5
6
Checking /etc/prometheus/prometheus.yml
  SUCCESS: 1 rule files found
 SUCCESS: /etc/prometheus/prometheus.yml is valid prometheus config file syntax

Checking /etc/prometheus/alert_server_down.yml
  SUCCESS: 1 rules found
And if it’s all good, restart the Prometheus service.
1
sudo systemctl restart prometheus
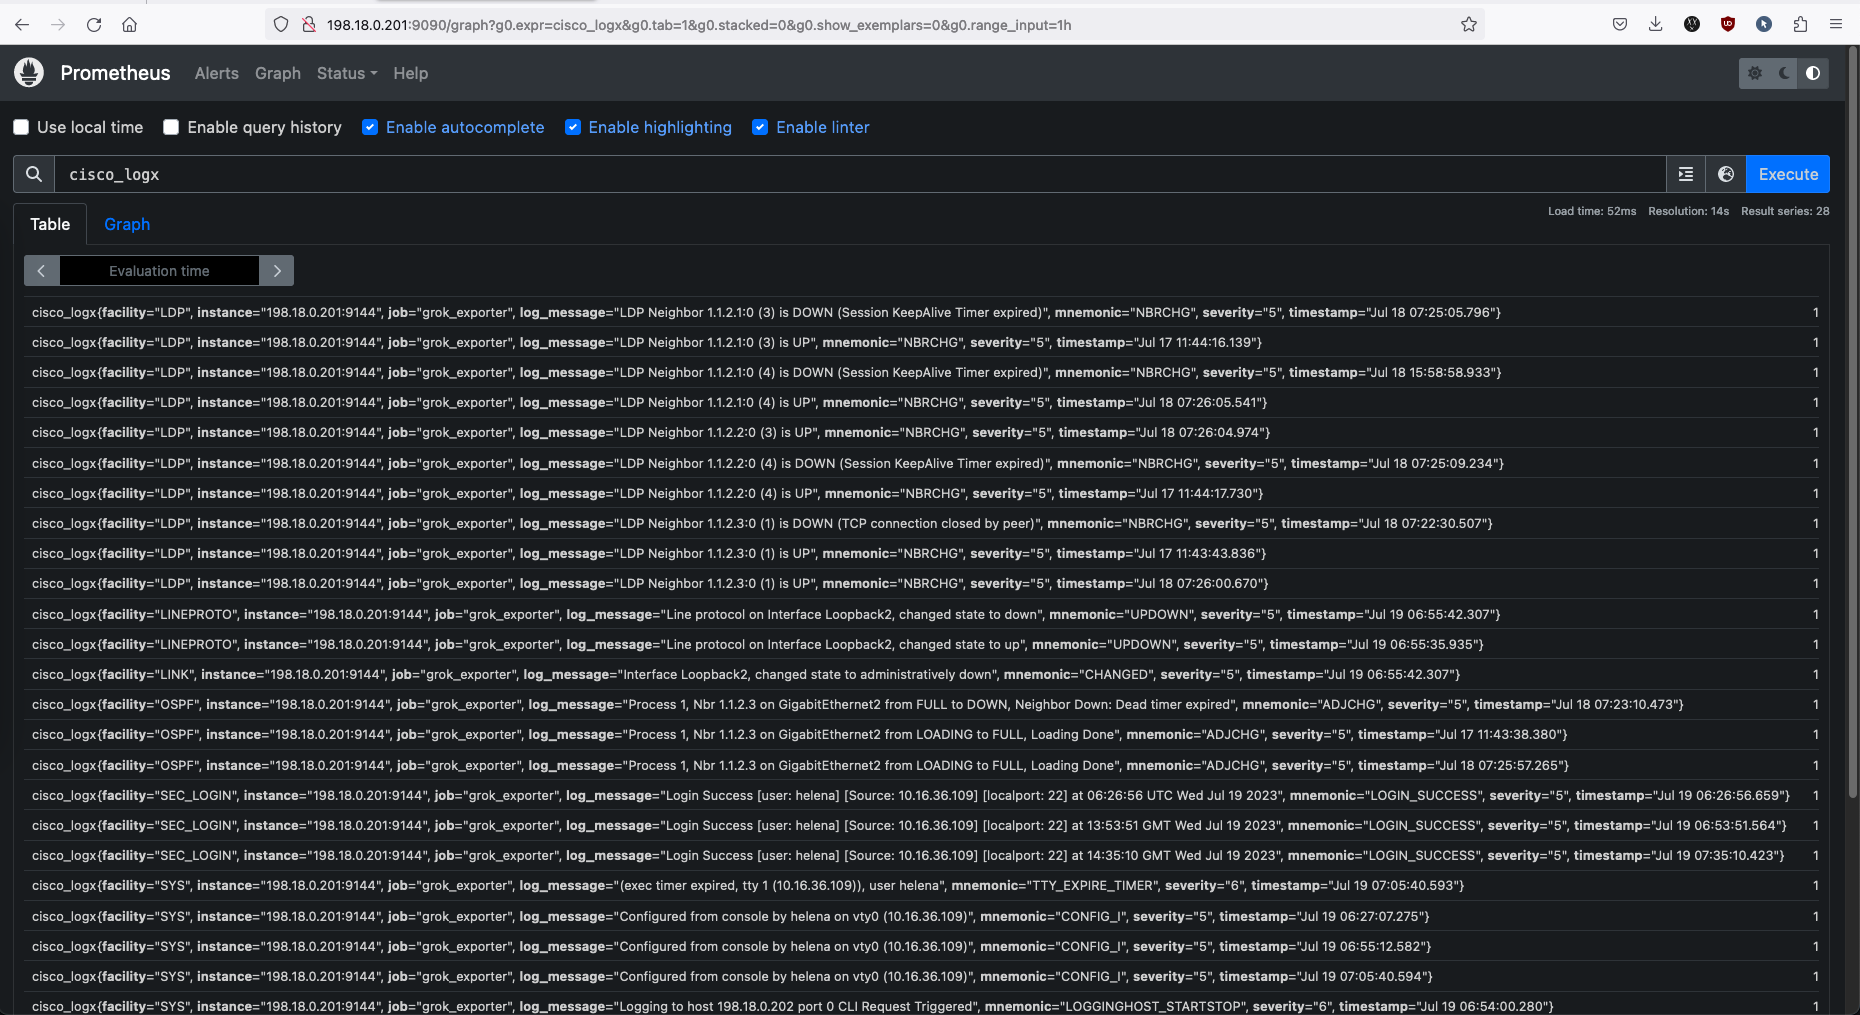
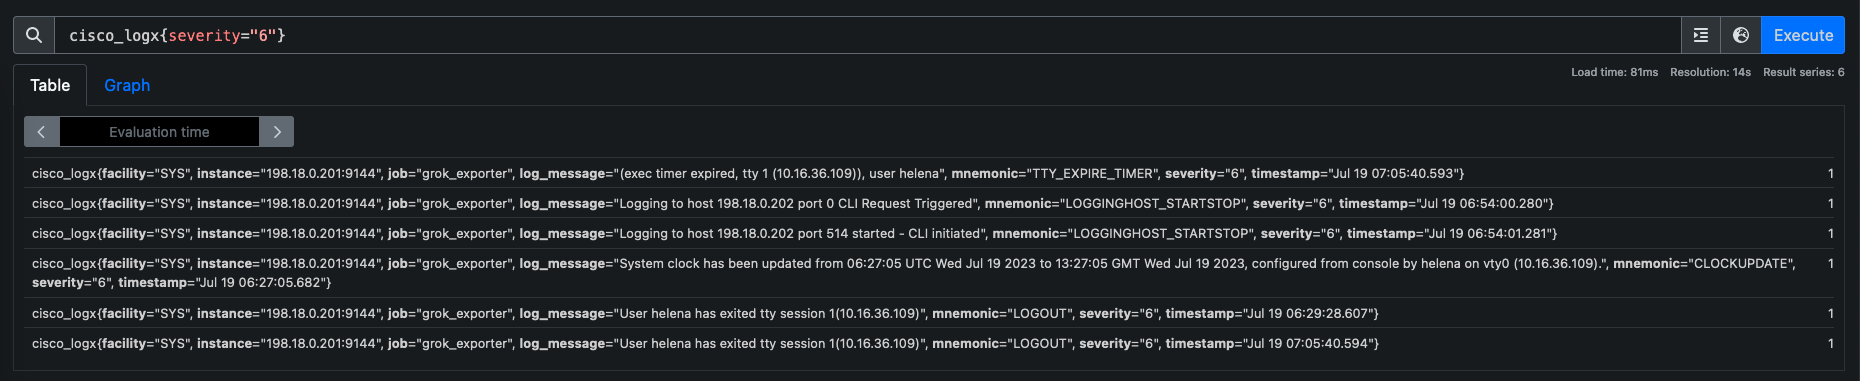
Now if you go to prometheus graph page, you will find these metrics under the name “cisco_logx”