Prometheus
What is Prometheus?
Prometheus is an open-source monitoring and alerting toolkit. It is widely used for monitoring the performance and health of computer systems and applications in a distributed environment. Prometheus follows a pull-based model, where it periodically scrapes metrics data from configured targets, such as servers, services, and containers.
Installing Prometheus on Linux
First, let’s create a service user named prometheus
1
sudo useradd --no-create-home -rs /bin/false prometheus
the –no-create-home -rs /bin/false ensures this user doesn’t have a home directory and cannot be used to login.
Then create directories for Prometheus’ configuration files
1
2
sudo mkdir /etc/prometheus
sudo mkdir /var/lib/prometheus
change the owner of those directories
1
2
sudo chown prometheus:prometheus /etc/prometheus
sudo chown prometheus:prometheus /var/lib/prometheus
Then download and extract the Prometheus file.
1
2
wget https://github.com/prometheus/prometheus/releases/download/v2.45.0/prometheus-2.45.0.linux-amd64.tar.gz
tar xvzf prometheus-2.45.0.linux-386
Next we need to copy the files to its respective configuration directories
1
2
3
4
cd prometheus-2.45.0.linux-386/
sudo cp prometheus promtool /usr/local/bin/
sudo cp prometheus.yml /etc/prometheus/
sudo cp -r consoles console_libraries /etc/prometheus/
And then open the prometheus.yml file
1
sudo nano /etc/prometheus/prometheus.yml
make sure it contains this configuration
1
2
3
4
5
6
7
8
9
10
11
12
13
14
15
16
17
18
19
20
21
22
23
24
25
26
27
28
29
# my global config
global:
scrape_interval: 15s # Set the scrape interval to every 15 seconds. Default is every 1 minute.
evaluation_interval: 15s # Evaluate rules every 15 seconds. The default is every 1 minute.
# scrape_timeout is set to the global default (10s).

# Alertmanager configuration
alerting:
alertmanagers:
- static_configs:
- targets:
# - alertmanager:9093

# Load rules once and periodically evaluate them according to the global 'evaluation_interval'.
rule_files:
# - "first_rules.yml"
# - "second_rules.yml"

# A scrape configuration containing exactly one endpoint to scrape:
# Here it's Prometheus itself.
scrape_configs:
# The job name is added as a label `job=<job_name>` to any timeseries scraped from this config.
- job_name: "prometheus"

# metrics_path defaults to '/metrics'
# scheme defaults to 'http'.

static_configs:
- targets: ["localhost:9090"]
Next we create system service file
1
sudo nano /etc/systemd/system/prometheus.service
Add this to the file
1
2
3
4
5
6
7
8
9
10
11
12
13
14
15
16
17
[Unit]
Description=Prometheus
Wants=network-online.target
After=network-online.target

[Service]
User=prometheus
Group=prometheus
Type=simple
ExecStart=/usr/local/bin/prometheus \
    --config.file /etc/prometheus/prometheus.yml \
    --storage.tsdb.path /var/lib/prometheus/ \
    --web.console.templates=/etc/prometheus/consoles \
    --web.console.libraries=/etc/prometheus/console_libraries

[Install]
WantedBy=multi-user.target
And that should be all. Now we start the service
1
2
3
sudo systemctl daemon-reload
sudo systemctl start prometheus
sudo systemctl enable prometheus
Check the service status with this command
1
systemctl status prometheus
1
2
3
4
5
6
7
8
9
10
helena@ubuntuhelena:~$ systemctl status prometheus
● prometheus.service - Prometheus
     Loaded: loaded (/etc/systemd/system/prometheus.service; enabled; vendor preset: enabled)
     Active: active (running) since Mon 2023-07-17 05:56:39 UTC; 46min ago
   Main PID: 4171 (prometheus)
      Tasks: 14 (limit: 9386)
     Memory: 31.7M
        CPU: 16.200s
     CGroup: /system.slice/prometheus.service
             └─4171 /usr/local/bin/prometheus --config.file /etc/prometheus/prometheus.yml --storage.tsdb.path /var/lib/prometheus/ -->
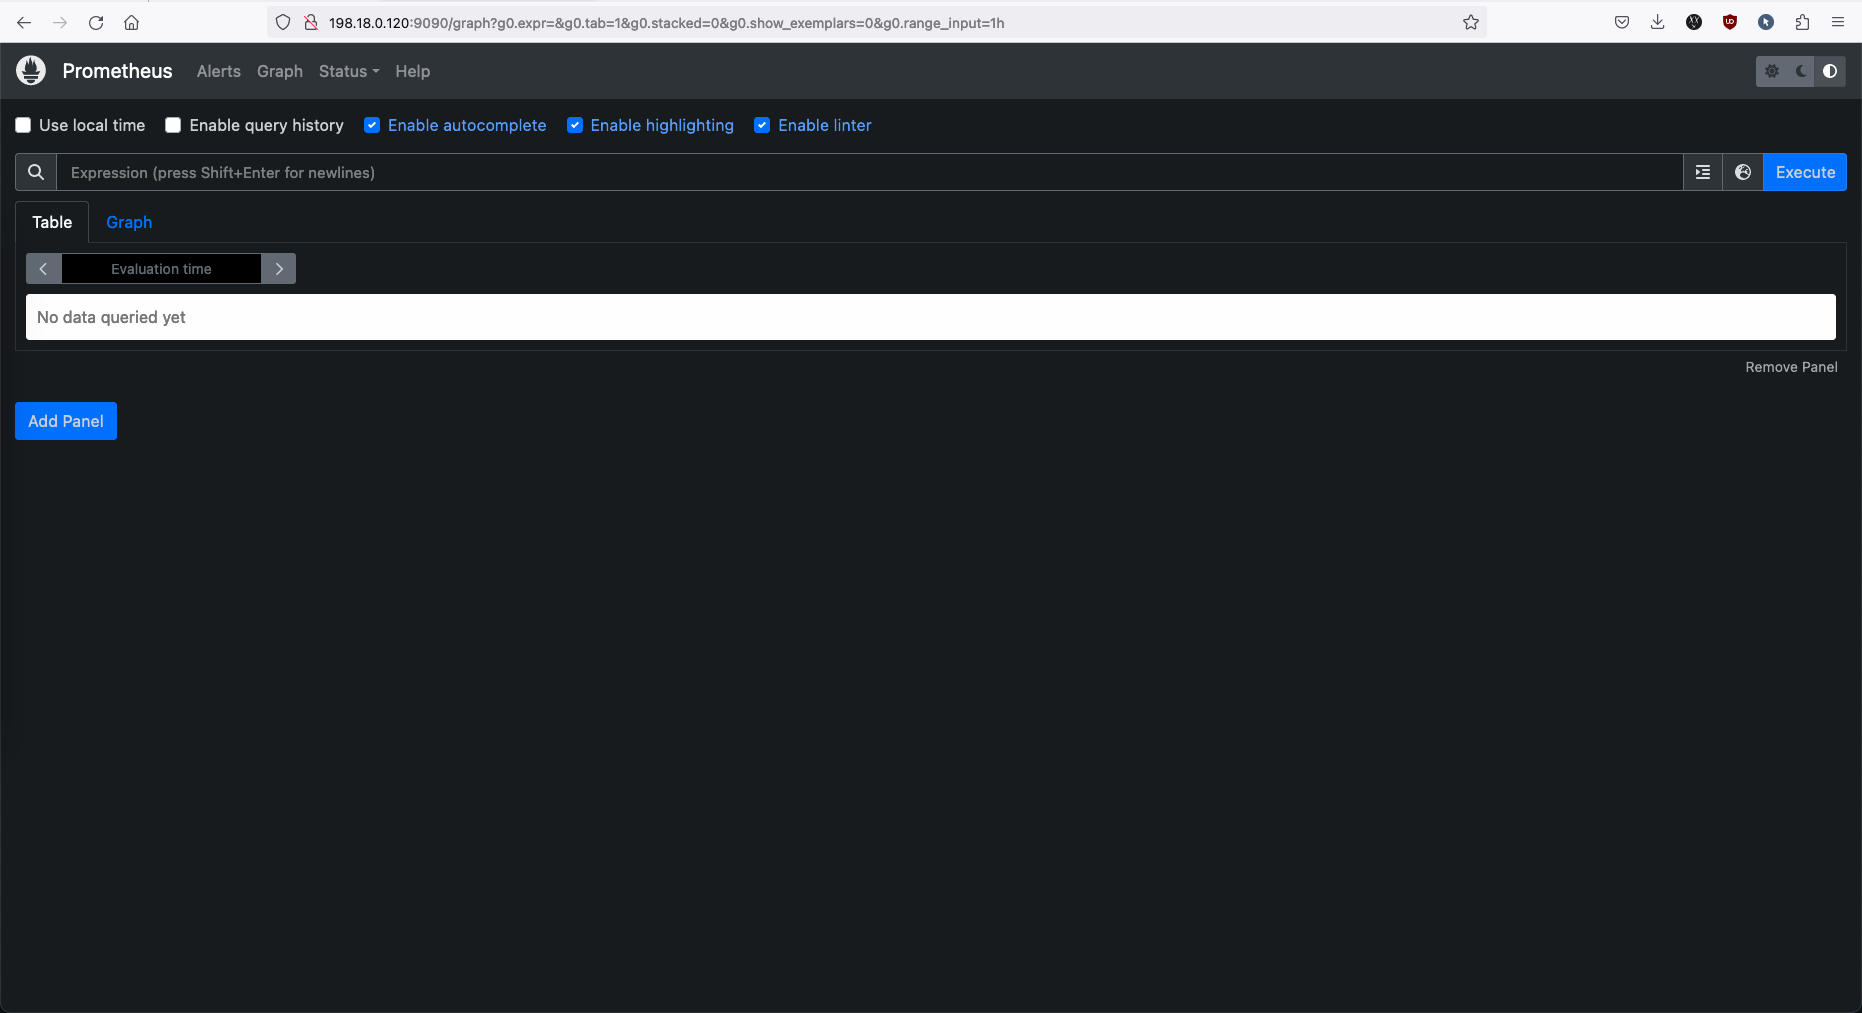
If it’s active and running, you can access it with browser on http://<the-ip-address:9090>
To check the status of your node, go to Status > Targets.
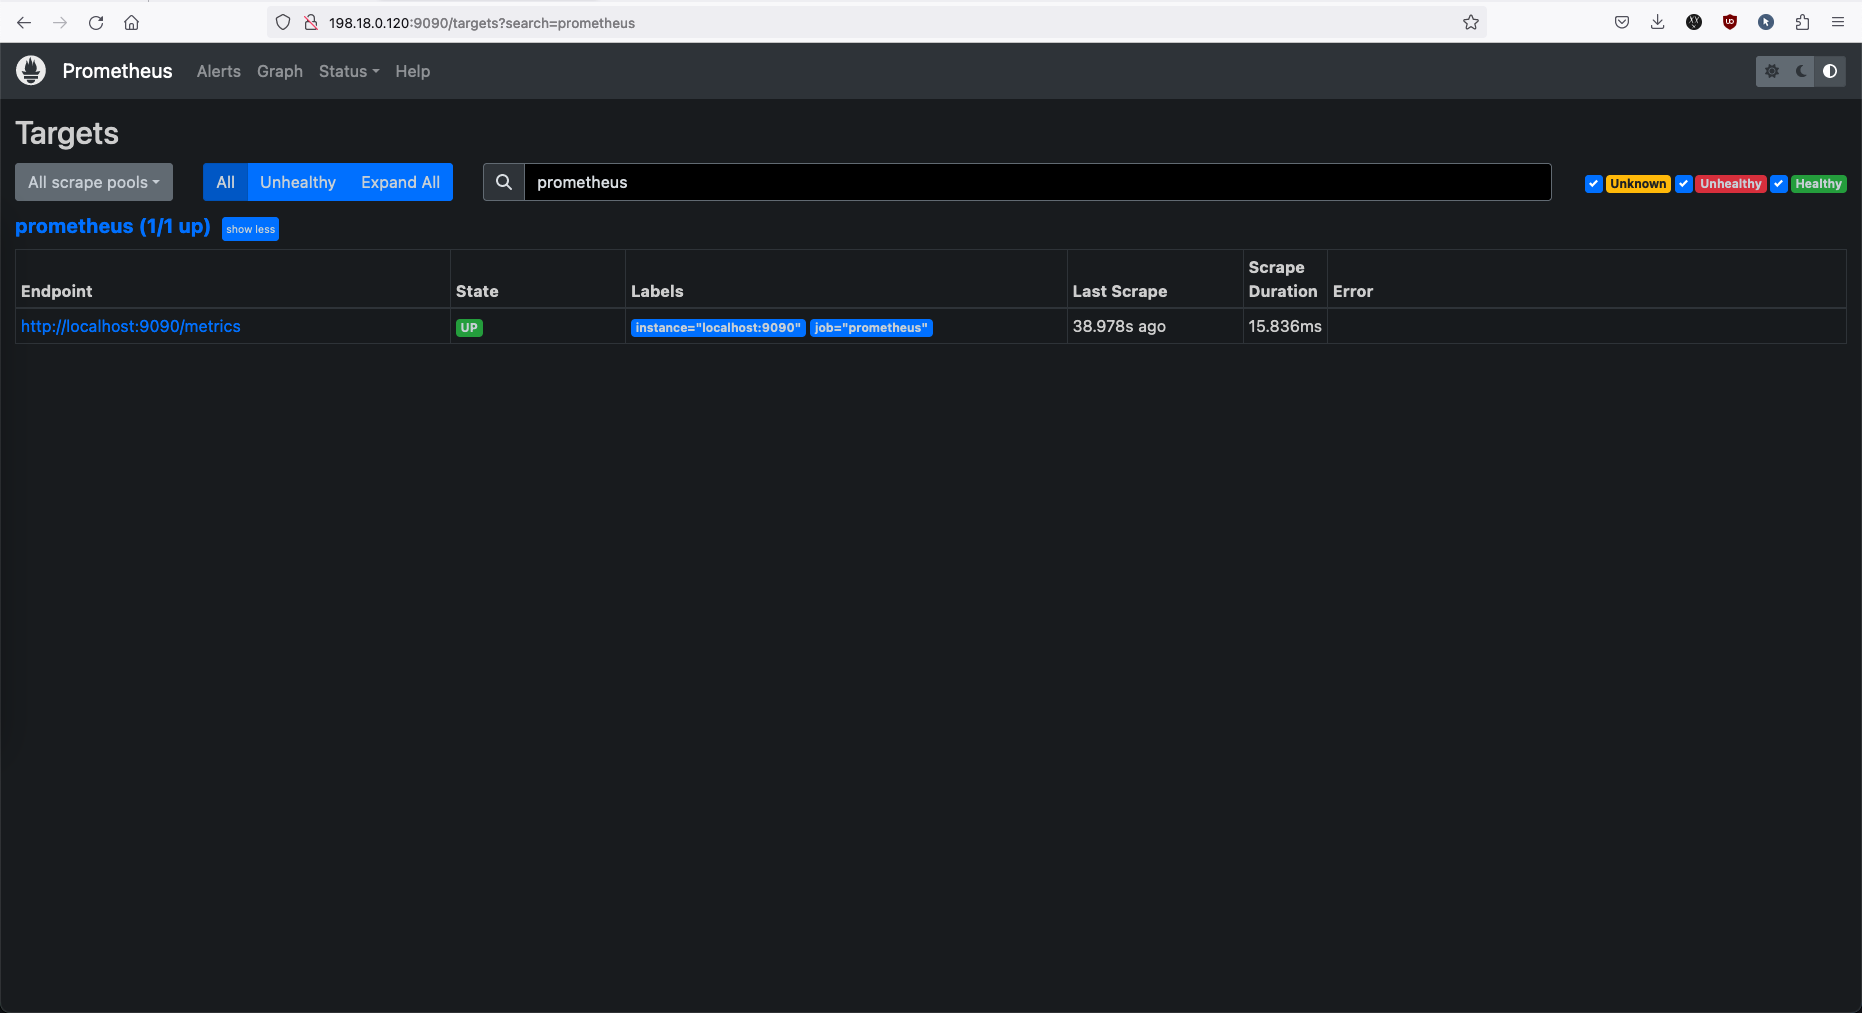
You’ll see that you have one node, which is the Premetheus Linux server itself. Next we’ll install some modules to add other nodes, like other linux servers and networking devices.